
Water Tester
Developed as apart of the UX Design module in my second year of study, the task was to develop our skills with arduino and app design by creating a product revloving around bispoke arduino sensors. Our group chose a water tester, which can test both the PH and TDS (total dissolved solids) of a sample of water.
Group Project:
Kyle Hope - Project lead. Developed sketches, renderings, physical prototypes (both models and arduino) and animation
Alex Makoni - Produced UX prototypes of app development using Adobe XD
Created - Latter half of second year
Initial Ideation
Starting at ideation, six quick concepts were developed. It was decided to use 3D printing pens as a source of inspiration for the design, as they are fairly large and would be able to house the arduino sensors we planned to use. The six concepts varied in form and each had their own uniqueness too them.

Developed Design
To develop the design into the final idea for the form of the water tester, features were taken from each of the six initial concepts. To work out which features would be used, the sketches were showed to numerous people who all pointed out a feature they liked most about each concept. Those fetures were incorperated into this design.
Rendering
Because the main focus of the project was on arduino and app development, rendering wasn't required. However, a better look at what the product might look like would prove useful in confirming whether this design was suitible. Therefore, a few quick renders were created.


Ergonomics Modelling
We wanted to test the ergonomics of the device before we put censors into it. To do this, a model was 3D printed and handed around a group of people to gather whether or not it was viable for how we intended the device to function. The result came back positive.


Arduino Prototyping
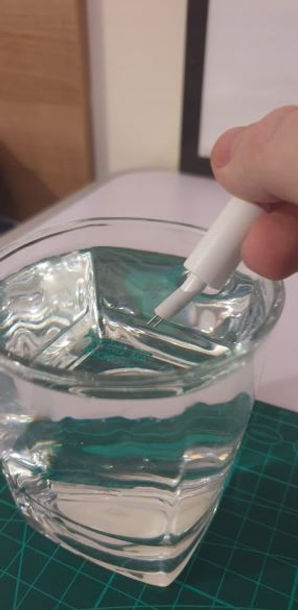
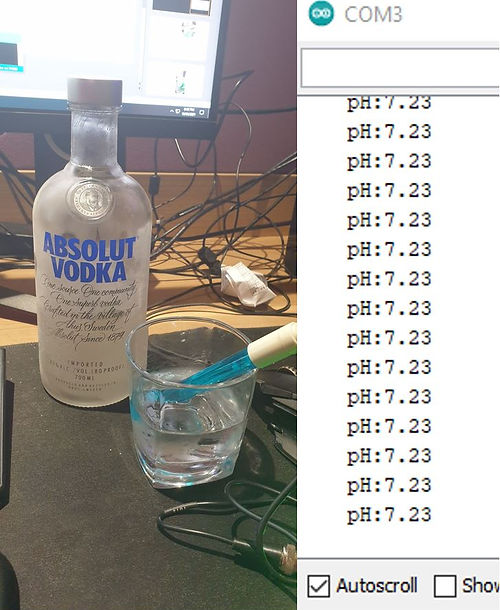
As mentioned previously, the two sensors chosen for this project were a TDS (Total dissolved sollids) and PH. These two sensors were new to me, but proved to be a valuable learning experience. Below you will see the way they were assembled with the Arduino Uno, the codes used for each, the testing conducted in order to confirm they were working as intended and how they fit into the 3D printed model.
TDS Sensor

PH Sensor


-
Includes the TDS sensor library
-
Sets pin A1 to the TDS sensors data
-
Approximate temperature. Float is used for numbers with possible decimal values
-
Sets the baud that the serial monitor will begin reading at
-
Reference voltage on ADC (default 5v)
-
1024 for 10 bit ADC
-
Starts the TDS sensor
-
Can include this with a temperature sensor (the one I have isn’t waterproof so couldn’t be added)
-
Sets the temperature
-
Samples and calculates the TDS value
-
Gets the value
-
Prints the value to the serial monitor
-
Adds ppm to the end of the value (parts per million)
-
Adds a 200 delay to the collection and printing of TDS value (faster delay more up to date value)

-
The PH sensors output is connected to the A0 pin
-
Stores the average value the sensor is outputting
-
Tests the serial monitor
-
Takes 10 sample values
-
Sorts the analogue from small to large
-
Takes the average value of the 6 centre samples
-
Converts the analogue value to millivolts
-
Then converts the millivolts into a PH value
-
Prints PH at the end of the value
-
Prints the PH value
-
Sets a delay of 800
Testing


Embeded into Model

App Development
When it came to app development, Adobe XD was used to wireframe and create an app. We wanted the app to be clear, concise and easy to use. Below are some examples from the app.


-
This is where the result of the TDS reading is shown
-
The colour of the test makes the visual clear on whether the water is safe to drink or not
-
There is also a section below the rating explaining what the rating means

-
This is where previous readings are recorded
-
Useful in situations where the app is being used for a series of tests
-
Can also be used to compare past results to see how the water has changed over set periods of time

-
This is where the PH of the water is displayed
-
Used as another indicator of whether the water is safe to drink or not
-
Uses the colours associated with that PH level, like on PH paper
In practice?
To wrap the project off, we wanted to demonstrate how we envisioned the app working with the physical product. So, using Adobe After Effects paired with processing (an app that can process arduino outputs and translate them into a programmed animation), I created a small example tying everything together.
